Something is wrong with enterprise AI infrastructure economics.
Not because the hardware failed.
Not because the deployments collapsed.
Not because engineering teams are incompetent.
Because the conditions under which AI infrastructure is purchased are fundamentally different from the conditions under which it actually operates in production.
That gap now has a name.
Ghost Capacity™.
And almost nobody is independently measuring it.
The Gap
We ran a production measurement study. Real infrastructure. Real workloads. Sustained operational conditions — not the controlled short-duration environments that vendor benchmarks are designed around.
We found two numbers.
Sustained runtime throughput diverging from benchmark expectations by as much as 39%. Consistently. Across hardware architectures, deployment configurations, and inference workload types.
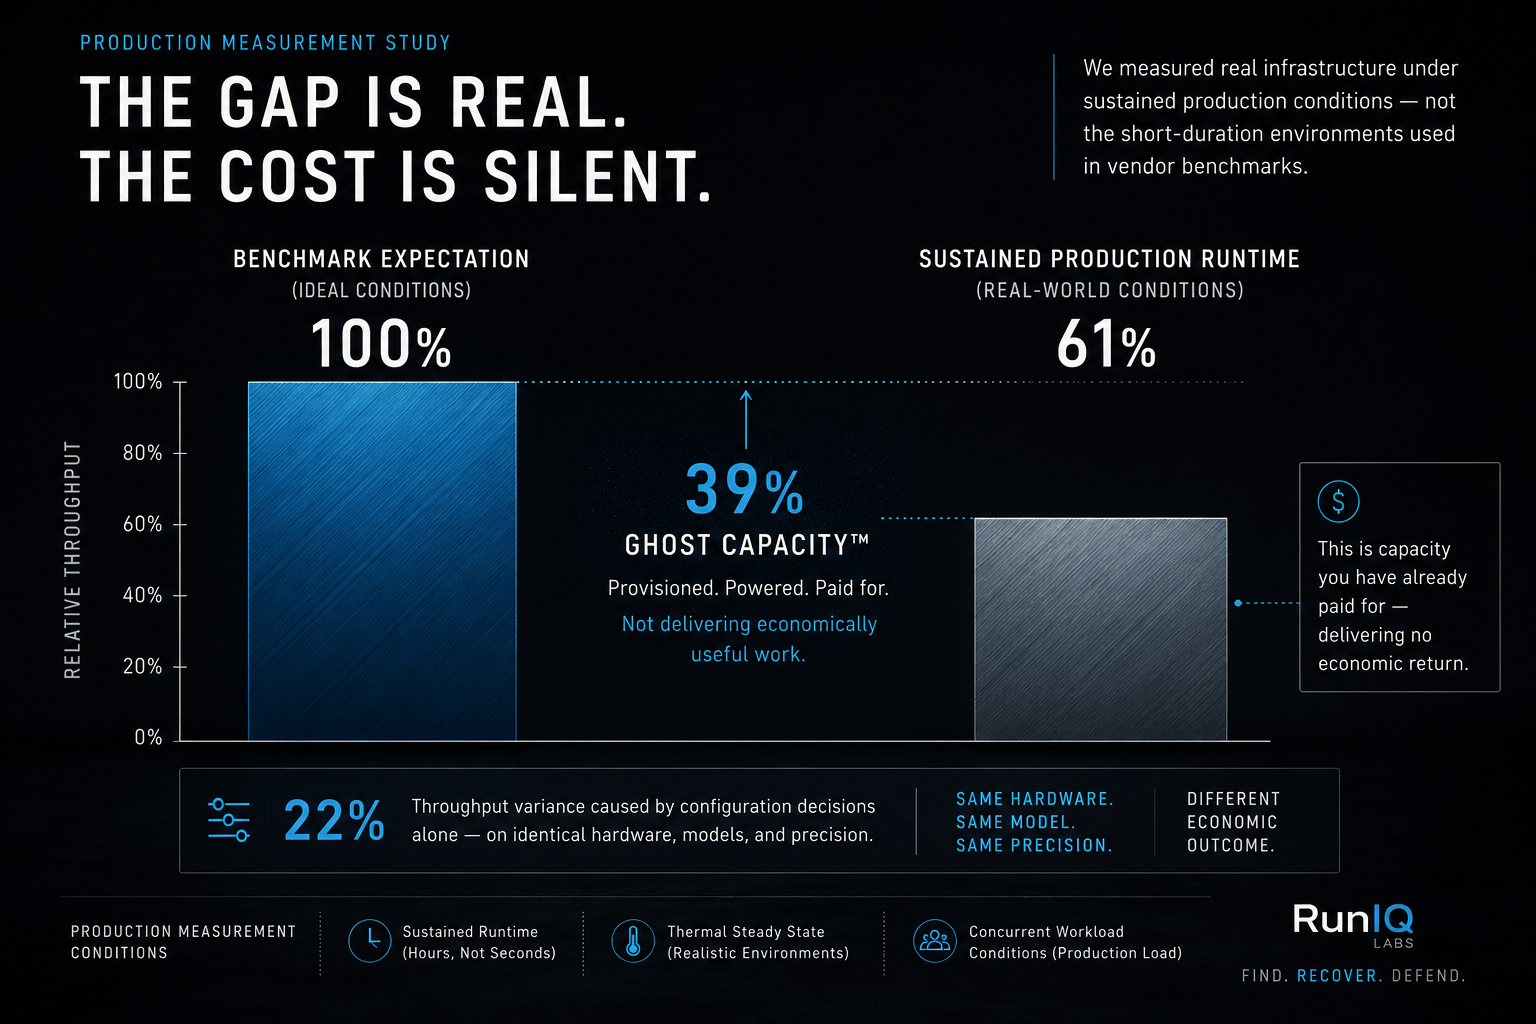
Then the second number — the one that kept us up.
On identical hardware. Identical models. Identical precision. Configuration decisions alone produced 22% throughput variance that translated directly into cost-per-inference divergence.
Same hardware. Same model. Same precision.
Different economic outcome.
You cannot buy your way out of this. You cannot upgrade your way out of it.
You can only measure your way out of it.
Why This Happens
The AI infrastructure market was not designed to deceive anyone. It was designed to move fast.
Benchmark conditions make hardware look its best. Short duration. Controlled thermals. Ideal memory states. Maximum frequency before power management intervenes.
Production is none of those things.
Production inference is not a qualifying lap. It is the 24-hour Le Mans.
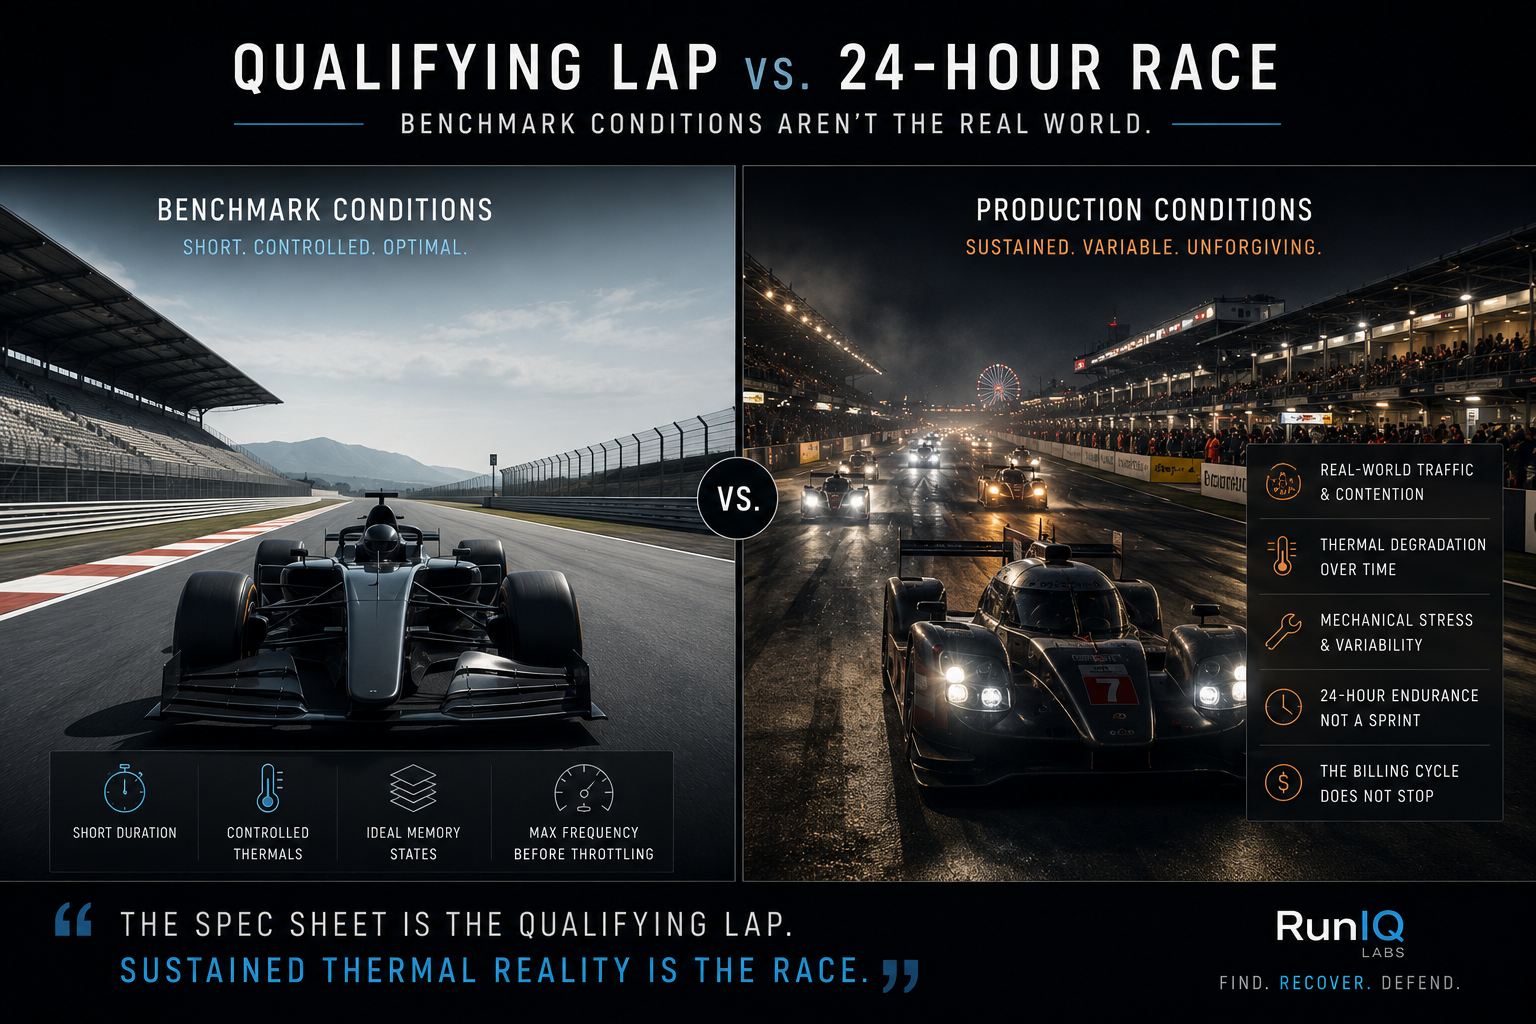
No one accepts a 39% gap between qualifying pace and race pace without asking why.
The AI infrastructure market has been accepting exactly that.
The monitoring tools enterprises rely on were built within the same ecosystem that optimized for benchmark performance. They surface the metrics that validate the purchase order — not the metrics that reveal the gap.
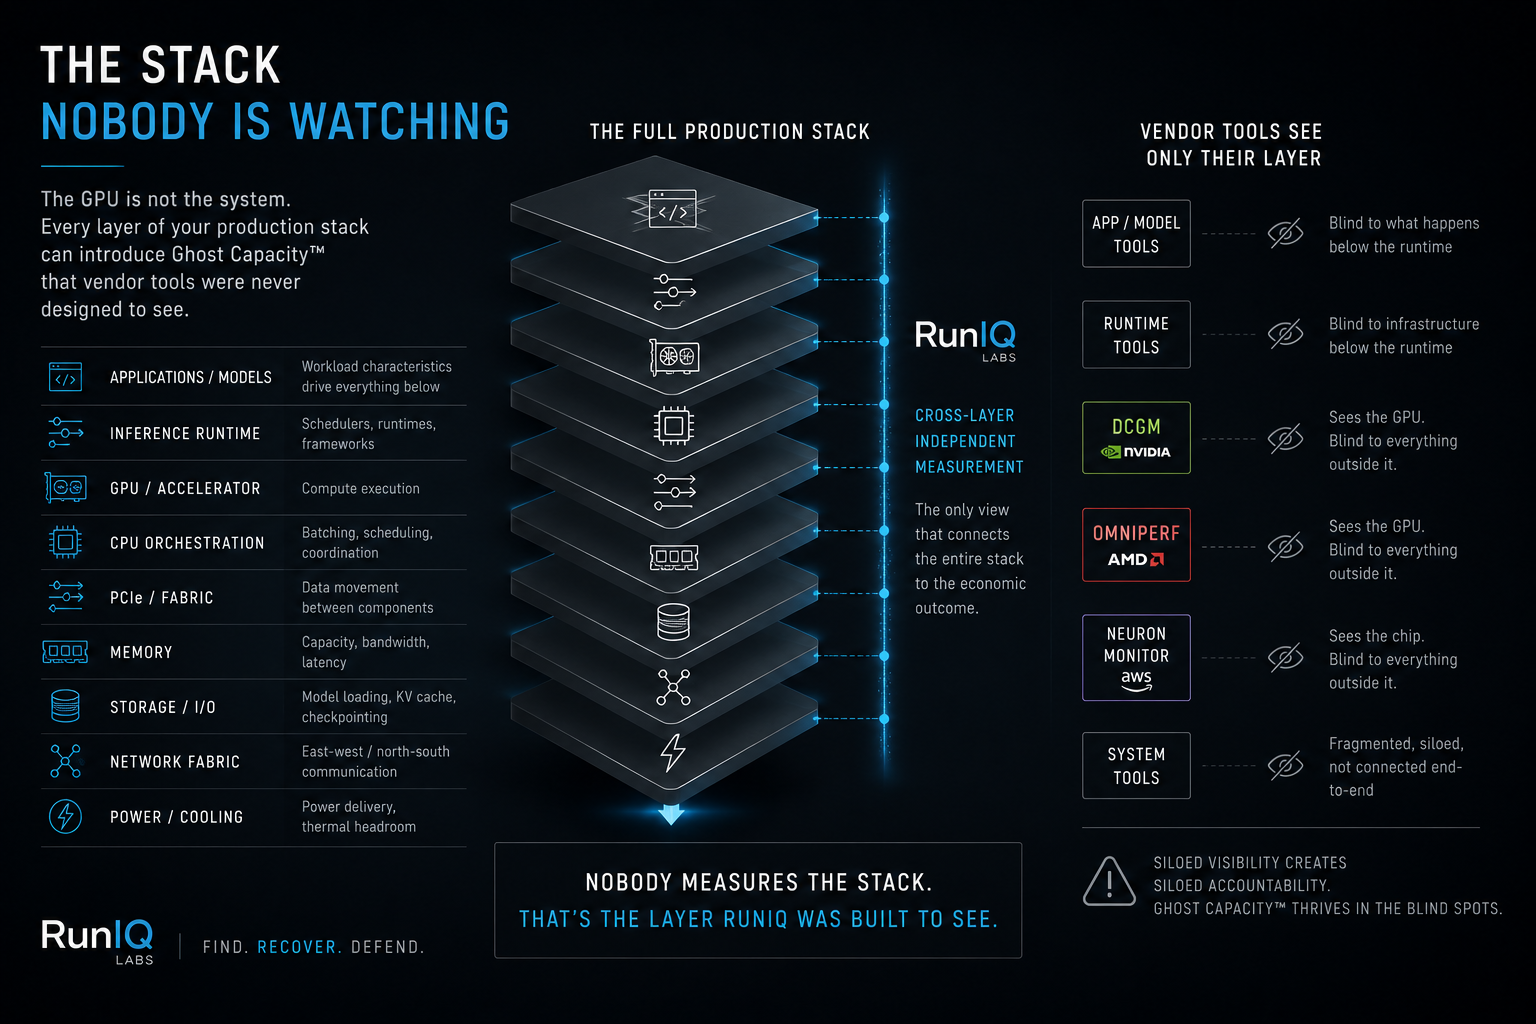
DCGM measures NVIDIA. Omniperf measures AMD. Neuron Monitor measures Inferentia.
Each tool is authoritative within its own architecture. Each tool is completely blind outside it.
That is how Ghost Capacity™ accumulates. Silently. Billing cycle after billing cycle.
The market optimized for benchmark performance. Now it must optimize for operational truth.
What It Looks Like In Your Stack
Our formal measurement study covered the four most widely deployed enterprise AI platforms: NVIDIA H100, A100, AMD MI300X, and AWS Inferentia2. Here is what we found.
While our formal characterization is grounded in those four architectures, the structural dynamics of Ghost Capacity™ are not unique to any single vendor. The patterns repeat. The signatures differ. The economics do not.
NVIDIA H100 / A100 — The Bandwidth Wall
HBM cannot feed tensor cores fast enough under sustained decode. The saw-tooth GPU utilization pattern has become widely accepted as unavoidable. It may not be. It is measurable. It is recoverable. KV Cache fragmentation compounds it. The power management unit — not the silicon spec sheet — determines your production ROI.
The spec sheet is the qualifying lap. Sustained thermal reality is the race.
AMD MI300X — The Fabric Penalty
The unified memory architecture removes one class of Ghost Capacity™. The Infinity Fabric introduces another — cross-die latency under frequent ACD memory access. CUDA-to-ROCm migration adds kernel fallback paths that manifest as unexplained performance loss. Neither surfaces in vendor tooling alone.
AWS Inferentia2 — The Padding Tax
Static graph execution requires fixed shapes at compile time. Production inference is not fixed. Workloads whose dynamic runtime distributions diverged from rigid compile-time assumptions produced the most severe Ghost Capacity™ signatures in our study. Structural. Silent. Invisible without independent measurement.
Groq, Cerebras, Tenstorrent
Our formal study does not yet cover these platforms. But Ghost Capacity™ follows the physics of silicon, memory, and sustained thermal behavior — not the vendor logo on the chassis. The patterns repeat. The signatures differ. The economics do not.
The Stack Nobody Is Watching
The GPU is not the system. It is one component inside a production stack whose economic behavior is determined by everything around it.
Every layer of that stack is a Ghost Capacity™ source that GPU tooling was never designed to see.
- Memory and host interconnect — when the host cannot stage data fast enough, the GPU waits. Utilization looks normal. Economic output is stranded.
- PCIe and fabric — data movement bottlenecks that do not appear in GPU metrics but show up directly on your bill.
- Storage and I/O — model loading and KV cache offloading under memory pressure create compute stalls GPU monitoring does not capture.
- Network fabric — in multi-node inference, a single misconfigured switch can strand compute across every GPU in the rack simultaneously.
- Power and cooling — infrastructure that cannot sustain peak GPU power draw forces thermal throttling that telemetry records as normal behavior. The root cause is physical. The symptom is on your bill.
- CPU orchestration — scheduling latency and batching inefficiency create GPU idle time that reads as available headroom but is not working.
The GPU vendor measures the GPU. The memory vendor measures the memory. The network vendor measures the network.
Nobody measures the stack.
That is the layer RunIQ was built to see.
The Fragmentation Problem
According to Jon Peddie Research, the AI processor market has grown from two viable GPU suppliers in 2014 to 161 companies across 18 countries today.
Every one ships a monitoring tool. Every one sees its own architecture and nothing outside it.
When every vendor tool sees only its own layer, the only entity that can see the full production picture is one with no architecture to protect.
In a market with 161 vendors and a full stack nobody is watching — independent measurement is no longer optional.
What You Now Know
Ghost Capacity™ is in your stack right now.
On your H100s. On your Inferentia2. In your PCIe interconnect. In your network fabric. In your power delivery chain. In your orchestration layer.
The benchmark numbers were not lying. They were measured under conditions that have nothing to do with your production environment.
That is not inefficiency. That is capital sitting stranded inside infrastructure you already own. Capital that could be working. Capital that could be generating materially higher return. Capital you have already paid for.
The organizations that measure it now will recover it.
The organizations that don’t will discover it later — after the consequences have compounded across quarters they cannot get back.
A detailed independent cross-architecture production measurement study — covering hardware counter methodology per architecture, the full-stack measurement framework, the Ghost Capacity™ quantification model, and the recovery architecture — is in the RunIQ Labs whitepaper.
The whitepaper documents the methodology, architecture findings, measurement framework, and recovery model in detail. For some organizations, reading it will be enough. For others, it will start a larger conversation.
FIND. RECOVER. DEFEND.
The RunIQ Labs AI Series
- Blog 1 — Introducing RunIQ Labs AI — We Built the Measurement Layer That Was Missing
- Blog 2 — The Data Is In. Here’s What We Found.
- Blog 3 — Ghost Capacity™ — Every Architecture Has It. Most Teams Have Never Measured It.
- Blog 4 — A Dashboard Tells You What Happened. A DDR Tells You What It Means.
- Blog 5 — You Benchmarked It. Now Who’s Watching It?